

As new driving patterns emerge from the pandemic era, data shows that roads are becoming more dangerous and driving behavior is evolving rapidly. The National Highway Traffic Safety Administration (NHTSA) projects that over 7,000 pedestrians died in motor vehicle traffic crashes in 2021, a 13% increase from 2020. Speed-related crashes were estimated to have increased 5% after having risen 11% in 2020.
Departments of transportation typically use crash data to determine high-injury networks or heat maps, but it can take years of data to ensure adequate sample sizes. Using trip event data from in-vehicle sensors and mobility data from a robust activity-based model, Replica and Arity created an alternative method.
To address rapid developments to dangerous situations on roads, we can pair Arity’s data on vehicle speeding events with Replica’s data on pedestrian volumes, resulting in a new dataset that determines where and when the most dangerous situations occur.
To demonstrate, we looked at Houston. We found that in the spring of 2021:
- Some of the highest combined rates of speeding and pedestrian volumes were far from the downtown central business district, where most pedestrian safety interventions are typically prioritized.
- These events tend to concentrate around residential neighborhoods adjacent to major arterial roads.
- Activity in the evening peak hours of 6 p.m. – 10 p.m. reveals that certain neighborhoods are more dangerous for pedestrians at specific times of day.
The Arity data used for this analysis covers non-highway speeding events on five weekdays in April 2021. The Replica data used in this analysis covers pedestrian volumes on a typical weekday in April 2021.
Where Pedestrians Face High-Speed Vehicles
By ranking areas by frequency of speeding events and pedestrian volumes, we can begin to see where there is the highest potential for crashes between high-speed vehicles and pedestrians.
Replica aggregated the data to the block group level and normalized by the area of each block group for both speeding events and pedestrian volumes, eliminating block groups with too few speeding events (either less than 5 or in the 95th percentile of speeding events) and those with too few pedestrian trips (either less than 25 or in the 95th percentile of pedestrian activity).
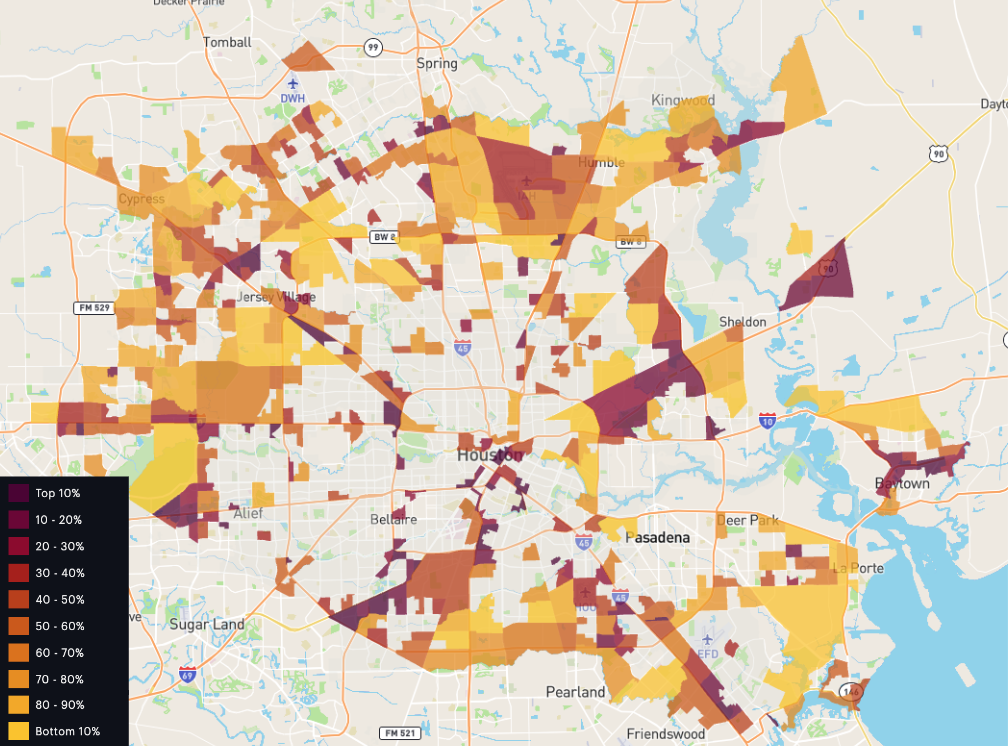
The results demonstrate that areas with high speeding and many pedestrian trips tend to concentrate around residential neighborhoods adjacent to major arterial roads.
Some of the highest rates of speeding and pedestrian volumes occur far from the downtown CBD in neighborhoods like Fondren Gardens, Willow Meadows, and Corinthian Pointe in the Southwest of the city. Others are closer to high-pedestrian areas, like the area around the University of Houston in the Greater Third Ward.
In Fondren Gardens, one census block group adjacent to Highway 90 experienced over 600 speeding events over the course of a week and over 500 daily pedestrian trips. Per square mile, that lands the block group in the top 1 percent of potentially catastrophic areas in Houston.
Some of the highest speeding events appear to be at highway ramps, many of which are in residential areas with pedestrian crossings.
One such example is at Sam Houston Parkway and Bissonnet Street in Westwood, which is in a block group that ranks in the 2nd percentile of high speeding and pedestrian concentration. Replica’s Places data can further identify vehicular and pedestrian trip routes that pass through this intersection and along other corridors with high speeds. A more detailed analysis can uncover potential for route diversion and enhanced active mode protections.
This analysis also highlights the inequities typically seen in pedestrian safety. The top ten block groups highest in pedestrian activity and speeding events are home to a greater proportion of residents with household incomes under $15,000 and non-White populations than those in Houston as a whole.
How Pedestrian Risk Changes by Time of Day
The temporal aspect of both datasets also allows us to identify the time of day when there’s high speeding and high pedestrian volumes.
Here, we see what pedestrian and speeding activity looks like between 6 p.m. and 10 p.m.

This is similar to the overall rate map, but it has important exceptions. In neighborhoods like Spring Branch East in Northwest Houston, combined speeding and pedestrian activity jumps into the top third of block groups, even though it’s about average when looking at a full day.
On the other hand, eastern Hunterwood, in Northeastern Houston, goes from being in the top 14th percentile of speeding and pedestrian events to dropping off the map.
This insight can empower local governments to respond with temporal interventions, like daytime signal timing changes. This is ideal to address safety concerns when they’re needed without affecting travel times during peak hours.
To further build this analysis out, Replica and Arity can create a high fidelity, normalized dataset at the network link or corridor levels. These steps would allow Houston and other cities to identify the most dangerous corridors for pedestrians without having to rely on crash datasets that often lag in time and lack in sample size.
If you’re interested in working with Replica to explore spending and activity trends in your area, or learn how our unique parking data can help augment this analysis, please get in touch.
About the Data
Born from insurance, Arity aggregates data from more than 40 million active mobile connections and nearly 1 billion miles of first-party driving data collected every day. With a high frequency of data collection, Arity’s driving events data identifies speeding, collisions, sudden braking, acceleration, and distracted driving in real time.
These insights are used to help customers make more accurate and reliable decisions around driving behavior and road conditions. One day of data provides about 5 million driver behavior data points in Houston alone. The Arity data used for this analysis is limited to non-highway speeding events on five weekdays in April 2021.
Replica’s Places product runs a unique, nationwide, disaggregated activity-based travel model to produce seasonal datasets that include pedestrian, bicyclist, auto, and freight trips at a network-link level. With regular model calibration and thorough validation against real-world ground truth data, the dataset produces robust estimates of mobility data in granular detail.
The modeled outputs are used by state and local governments, as well as private consultancies, to make smarter policy and program decisions in a myriad of applications. The Replica data used in this analysis is limited to pedestrian volumes on a typical weekday in April 2021.


