As states plan for urgent investments in a national EV charging network, now is the time to consider how electric vehicle charging infrastructure will be needed during emergency conditions, such as severe weather events.
The federal government’s Electric Vehicle Charging Action Plan calls for a national network of 500,000 publicly accessible EV chargers in eight years. As of January 2022 there are almost 113,600. Florida has been crafting its Electric Vehicle Roadmap with hurricane evacuations in mind, weighing how to prioritize investments that can serve residents well on typical days and be useful during evacuations.
The state’s EV roadmap acknowledges the difficult trade-offs: Some locations that would be useful during evacuations wouldn’t see enough day-to-day demand to justify permanent infrastructure at this early stage. (The report recommends mobile EV charging locations that can be deployed as needed.)
Additionally, in order to plan an equitable deployment in line with the federal Justice40 Initiative, planners need to know how potential charging locations fit into the mobility activity of people around them.
We’ve written before about ways to consider equitable EV charging infrastructure and how data can help unlock EV infrastructure funding. Now we want to dive a little deeper, using Replica data to see how Florida’s EV charging network serves the state along two primary evacuation routes that cross the state — I-10, going east-west, and I-75, going north-south — as well as the state’s disadvantaged communities.
Below, we look at:
- How state evacuation routes are served by EV chargers today
- Attributes of trips and people traveling along state evacuation routes
- How existing and planned EV chargers and mobility patterns overlay with disadvantaged communities
- How mobility and gas-station spending change during extreme weather
EV charging access on evacuation routes
To better understand the state of access to existing and planned EV chargers along Florida’s evacuation routes, we mapped it out. (click here to view the interactive map on Unfolded)
The map shows a one-mile buffer zone around the I-10 and I-75 evacuation routes, plus the locations of Florida’s DC fast chargers, which can provide a full charge in about 30 minutes, depending on the type of vehicle. Viewers can also toggle on layers to see the locations of slower EV chargers (Level 1 and Level 2) and geographies for disadvantaged communities as defined by the Justice40 initiative.
It’s not surprising that large gaps exist in the current EV network: the technology is relatively new, EVs are still only a fraction of all cars on the road, and most EV owners are able to charge their cars at home. But when assessing emergency preparedness, it’s important to note that drivers would have few options for accessing fast chargers (Level 3) directly along evacuation routes.
That’s especially clear in the stretches of I-10 on either side of Tallahassee and on I-75 when it crosses the state between Fort Lauderdale and Naples. Chargers are mostly concentrated within cities, which might be helpful for those starting a journey, but could require time-consuming detours if needed in the middle of an evacuation.
Replica data helps analyze travel behavior in disadvantaged communities
To invest equitably along evacuation routes, it’s important to understand who uses those roadways on a typical day.
Using Replica’s disaggregated trip and population data, we can easily learn more about the types of trips and travelers on I-10 and I-75 under normal conditions.

The maps above show the distribution of residences throughout Florida (left) compared to the home locations for people who travel on I-10 (middle) and I-75 (right) on a typical day in fall 2019. It’s not surprising that home locations along these two routes are concentrated nearby — and the same is true for work locations — but this analysis shows one impact of decisions to prioritize these routes for EV charging stations.
We can also understand more about the trips and people that will have access to chargers along these routes under normal conditions.

Trips on I-10 and I-75 are substantially longer, both in mileage and duration, compared to all trips in the state. This information could support the case for EV chargers along these routes, as they see much larger percentages of long-distance trips: Approximately 40% of all trips on the two routes were greater than 32 miles in Fall 2019, compared with just 7% statewide. Approximately 20% are over 64 miles long, according to Replica data.
Justice40 equity analysis for electric vehicle infrastructure
The Justice40 Initiative aims to “deliver 40 percent of the overall benefits of federal investments in climate and clean energy, including sustainable transportation, to disadvantaged communities.”
To get a better understanding of how EV charging investments could serve disadvantaged communities in Southeast Florida, we paired the U.S. Department of Transportation’s map of disadvantaged communities with the U.S. Department of Energy’s EV charger data and Replica’s data about mobility, demographics, and socioeconomic attributes in Broward, Miami-Dade, and Palm Beach counties.
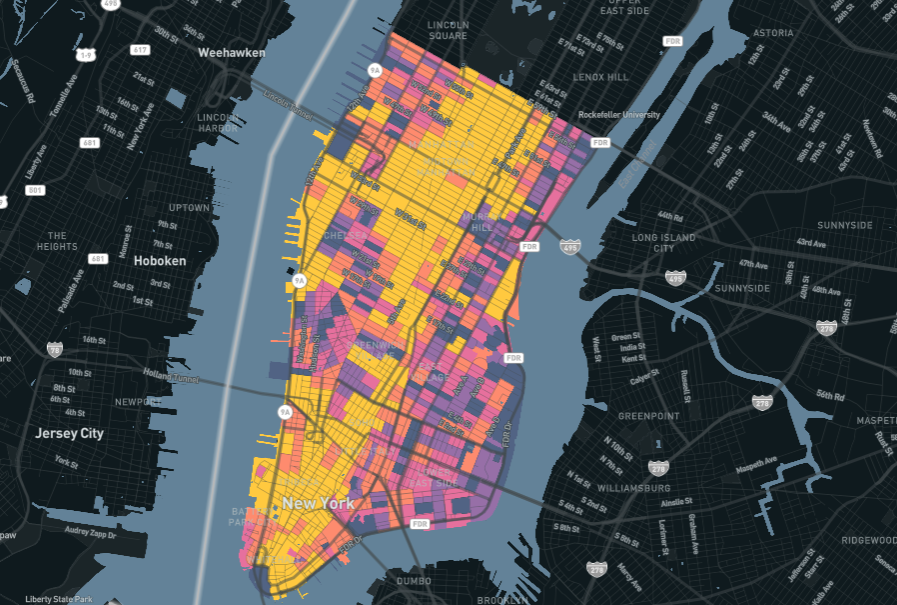
The default view in the map above shows evacuation routes (magenta lines), Justice40 geographies (pink shapes), EV fast charger locations (blue dots), density of all EV chargers (bubbles with gray outlines), and aggregated origin-destination (O-D) pairs for people of color whose households make less than $50,000 a year (yellow arrows).
Use the map key to explore a few different visualizations of socioeconomic attributes: You can turn off the O-D pairs layer and instead turn on layers to see traffic volumes and/or vehicle miles traveled (VMT) per capita by census tract for low-income people of color in these three counties.
As we noted earlier, there are many gaps in the EV charging network, especially when it comes to fast chargers. That’s true in disadvantaged communities and in wealthier areas. But access to an EV charger is determined by more than fixed geographies: People move around, and they can be served where they travel in addition to where they live.
Our map offers a few ways to explore what equity-oriented investments might look like. For instance, the origin-destination pairs layer reveals where there are few, if any, EV chargers along hurricane evacuation routes in areas that have:

Seeing what happens when it happens
Lastly, we wanted to look at what happens to mobility trends during an extreme weather event.
As just one example, we zoomed in to the census tracts around I-10 near Pensacola for the 2020 hurricane season — the most active Atlantic hurricane season on record.
Hurricane Sally made landfall not far from Pensacola on September 16, 2020, and caused widespread damage and flooding, with many roads remaining impassable in its wake. Replica Trends data shows the massive drop in all types of trips after the storm, and how it rebounded after: There were 250,000 trips in these census tracts the week before the storm, 200,000 the week of, and 290,000 the week after. Consumer spending at gas stations similarly rose before and after the storm, suggesting people prepared for the storm by filling up their tanks, and refueled once they returned home. (The Pensacola area saw voluntary evacuation orders during Hurricane Sally.)

Assessments like these ones bring new dimensions to understanding the impact that EV infrastructure investments can have.
With a fast-evolving technology and an urgent need to address inequities, comprehensive, disaggregate mobility and socioeconomic data can take the guesswork out of infrastructure planning and investments and help build more equitable and resilient places.


.jpg)