


A recent survey by the National League of Cities and US Conference of Mayors found that 50–76% of mayors anticipate having to cut public services while remaining responsive to residents’ needs. Nowhere is this more apparent than how residents are moving within their cities and regions to access jobs, essential services, and other activities. Below, for example, we show how many New Yorkers have reduced their subway rides, causing ridership recovery to stagnate, while others have opted for other modes of transportation.
For agencies in charge of delivering these public services amid declining revenues, Covid-19 response and recovery presents an inevitable reshaping of American life in cities. This also brings great opportunity for public agencies to make data-driven, people-centered decisions with limited time and capital. As the saying goes, we’re out of money; now it’s time to think.
Public agencies know they cannot move forward with the same tools and same information to recover from this pandemic. To understand the relationships and trade-offs behind decisions public agencies need to make, we need:
- data about what’s happening now
- the ability to see the connections between disparate data points
- to understand how a jurisdiction fits into a regional context
In this first of a short series on how Replica’s data platform can help inform these important decisions, we look at how people are moving in cities and regions, and how they are adapting their movement to target more effective recovery strategies while public agencies continue to balance public health, economic concerns, and limited resources.
1. How Are People Moving?
Since the beginning of the Covid-19 pandemic, Replica has been providing daily data to several regions in the US to assess the pandemic’s impact on people’s mobility patterns. This data and analysis helps policymakers understand where and how much people are adapting their travel behavior, especially given the shelter-in-place orders (and recommendations) put in place in various regions at different times. For example, shelter-in-place orders went into effect initially on March 16 in the Bay Area, March 20 in New York City, March 21 in Illinois and New Jersey, and March 30 in Maryland, Washington, D.C., and Arizona, with states and regions recently re-issuing shutdown orders for certain industries.
Change in People Commuting to Work and School
With total movements down more than 20% since early March, we would expect to see the number of people travel to work or school also down. And down it is. Since the first week of March, the number of people traveling to work or school is down more than 40%. Some of this delta of change between total movements and work/school movements is certainly attributable to schools being closed for much of this time period. Unlike total movements, the number of people commuting to work and school has increased, albeit very slowly, almost every week since late May, when it bottomed out at nearly a 65% decrease. This metric feels particularly important for cities to monitor given the impact commutes have on both transportation and economic activity.
Figure 1: Daily trip volume between census tracts for select regions in the United States
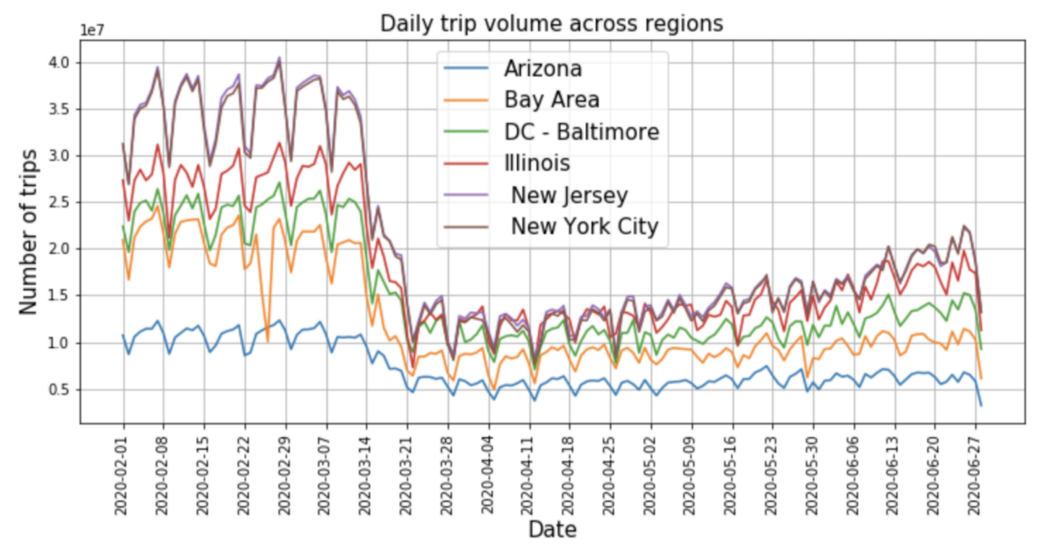
Even before the initial shelter-in-place orders, people were significantly limiting their daily trips by early March in every region we looked at (see Figure 1 above). The Bay Area, for example, was one of the first regions ordering residents to stay home for all but essential activities. As of March 15, the Bay Area witnessed a 50% decrease of normal trip volume. Nationally, in late March and early April, people mostly stayed home, with under 40% of pre-pandemic trip volumes in New York, New Jersey, or the Bay Area. In Arizona, however, about 50% to 60% of usual trip volumes were still occurring despite the stay-at-home recommendations. By mid-May, trip volumes in every region started to increase again, even if shelter-in-place orders were still active in multiple regions. As of mid-June, the Bay Area trip volumes are about 50% of pre-pandemic levels, whereas in Illinois, Arizona, and Washington, D.C./Baltimore, they reached above 60%. For states like Texas and Florida that did not immediately execute shelter-in-place orders and then reopened earlier, they have had to reverse their reopening plans as Covid-19 cases have surged, overwhelming their hospitals.
Despite recent surges stalling certain statewide reopening plans, people are moving more today compared with early on in the Covid-19 pandemic. Monitoring these daily — or even weekly — changes in people’s movements can help public officials design targeted reopening interventions.
1. How Are People Moving?
At Replica, we are also monitoring changes in the transportation modes people are choosing. While residents might be starting to take more trips, the data below suggests that people are changing their behavior in terms of preferred modes of transportation and types of trips taken.
New York City, for example, makes its Metropolitan Transit Area daily turnstile traffic publicly available, which provides some insight into how the largest subway system in the U.S. in one of the hardest-hit regions is affected by the ongoing crisis.
Figure 2: Daily volume of turnstile entries for NYC MTA subway, across all lines, compared with February 2020 baseline
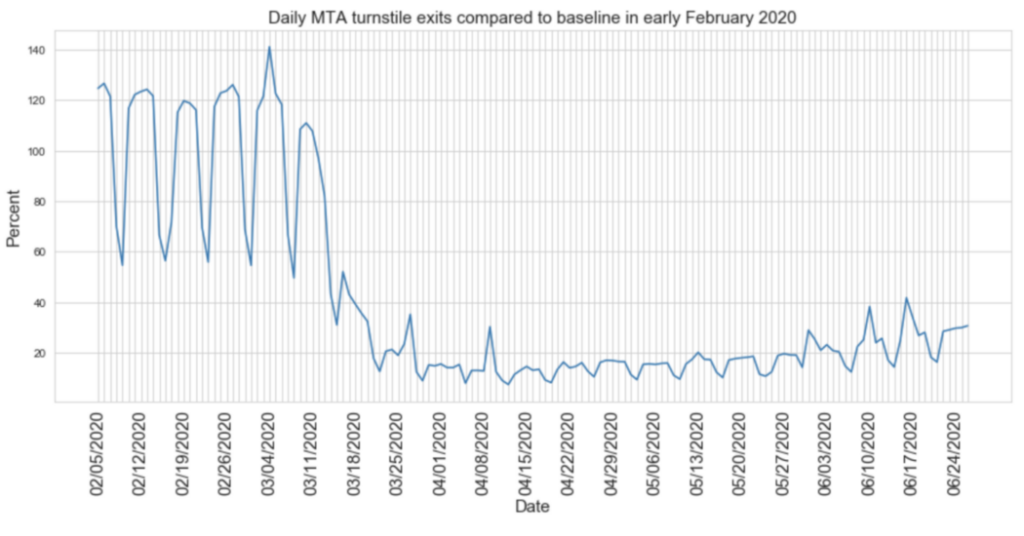
Pre-pandemic, MTA ridership peaked weekly at over 5.8 million daily turnstile entries. During New York City’s shelter in place, the lowest observed daily volume was just 5% of the pre-pandemic baseline (early February 2020). As of late June 2020, MTA ridership is still around 30% of what it used to be, despite the slow reopening of the city. This figure is in stark contrast with Figure 2, emphasizing that the volume of trips in NYC may be back to about 50% of pre-pandemic levels, but the volume of subway trips is lagging far behind: The mode split is no longer what it was before the pandemic.
Further, transit user demographics have shifted because of the pandemic. Pre-pandemic, the median age of a rider was 41 years old with a median household income of $75k, with 72% of riders having none or one vehicle in their household. About two thirds of trips were made by employed residents. While the pandemic has led to a significant decrease in trip rates for all income groups, high-income earners ($125k+) had a trip decrease of about 30%, whereas low-income earners (<$40k) decreased trips by 10–20%. So MTA’s rider profile has also changed — all people are riding less, but lower-income households have seen a smaller decline compared with higher-income households. Various studies disagree on the role that public transportation plays in spreading diseases, but what is clear is that residents are hesitant to ride public transit — if they have other options — again.
While the far-reaching impacts of the global Covid-19 pandemic are still being understood, we can empirically demonstrate that this crisis is reshaping how we move within our regions and how people are moving to access basic goods, services, and jobs. In our next post, we will look at how public agencies should take into account these movements to reduce contact risk as they relate to different places, and consider which ones pose a higher risk of spreading Covid-19. For any additional questions or information, please contact us!


