To the Replica community: thank you for our best year yet!
The last 12 months at Replica have been faster-paced than ever as users leveraged both high-fidelity seasonal data and powerful applications for thousands of analyses. We delivered a dozen applications, expanded features in our core product, and delivered the seasonal updates we’re known for.
Our users took advantage of our most complex and powerful applications.
In 2024, we significantly expanded our software platform, drawing upon thousands of discussions we’ve had with customers to create tooling for your most critical workflows. These newly-developed tools include:
- Road Closure Scenarios: Simulate traffic patterns with custom road closures to understand the impact on travel behavior and the network so you can include details in your plans like traffic diversion patterns, estimated impacts on daily travel and the environment, socio-economic communities affected, and more. Massachusetts Department of Transportation, the Greater Nashville Regional Council, and Mid-America Regional Council took advantage of this app to study road closures on vital arteries for construction and design scenarios.
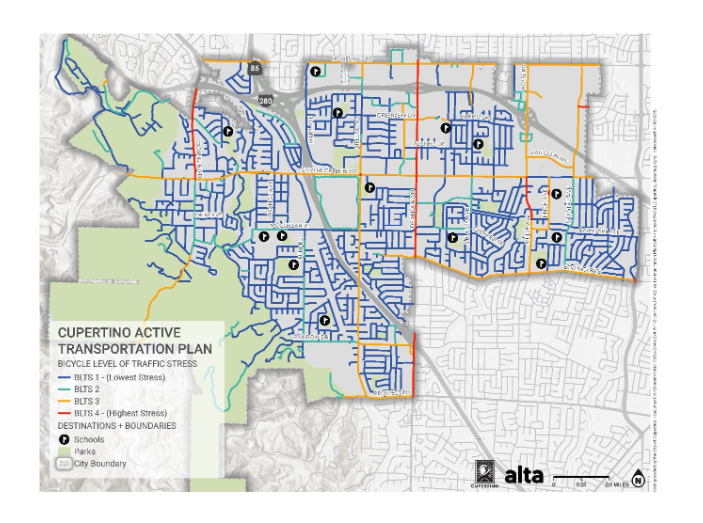
- Active Transportation Analysis: View cycling, walking, and latent demand for active transportation infrastructure at a census block group, network/corridor, and county level. With this app, compose comprehensive infrastructure plans, visualize and measure the impact of project proposals, and triage for the highest impact projects.
- Origin-Destination Analysis Tooling: Visualize hundreds of thousands of OD pairs in an interactive map-based interface, and incorporate custom geography and trip filter features, and identify sources of VMT growth by geography and trip purpose, understand flows by time of day to better plan road maintenance schedules, and more. The top Origin-Destination App users included Texas Department of Transportation and Metropolitan Transportation Authority, who used these applications to visualize our data.
Over the last year, users derived unparalleled value from our platform.
Thousands of users across hundreds of organizations created over 7,400 studies, deployed applications more than 5,700 times, and uploaded more than 2,800 custom geographies, powering unique analyses specific to your exact parameters. Some of the most common studies were origin-destination studies, corridor volume analyses, and vehicle miles traveled (VMT) studies.

- We welcomed dozens of new agencies into the Replica community, including the Georgia Department of Transportation/Atlanta Regional Commission, the Louisiana Department of Transportation and Development, and Los Angeles Department of Transportation. These partnerships will bring high-fidelity data to states across the country, enabling analyses like safe streets planning and rapid scenario modeling.
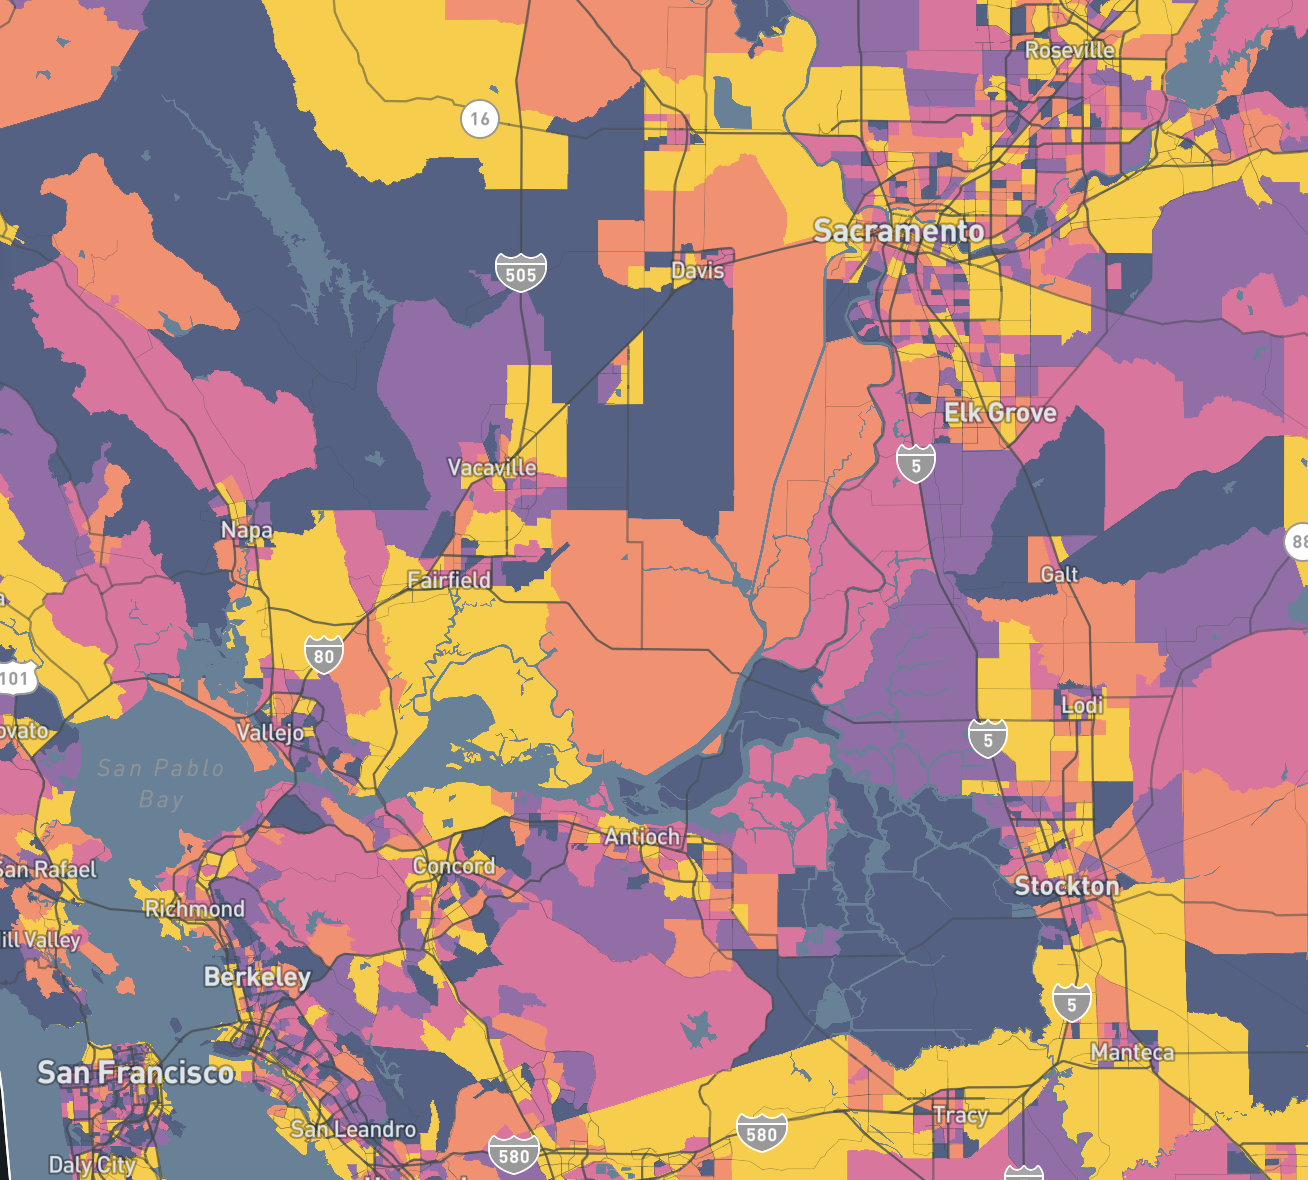
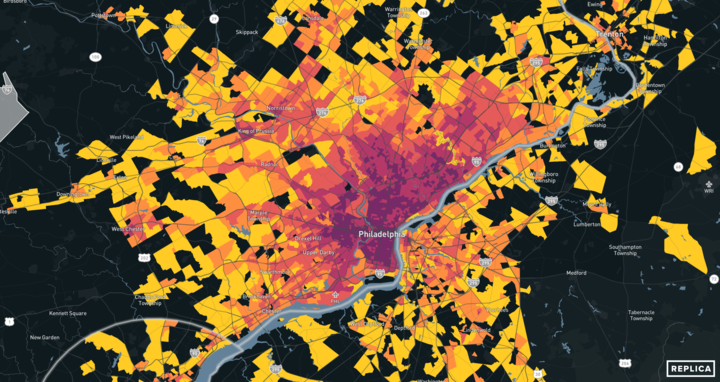
- New features included selecting H3 cells as a standard geography (shown below), downloading maps and legends in various formats, and the ability to select up to 50 network links.

We’re just getting started.
Next year, we’ll bring more features and new applications to the table, including:
- EventSight: See your city better with EventSight, a tool for analyzing the financial and visitation impacts of events in a given location. Using a custom geography, define the dates of your event of interest, a baseline of comparison for the event (e.g., Friday afternoons in the summer), and see the impact of the event on total spend and total visitation.
- Continuous Upgrades: Expect the platform to get better and better with UI upgrades, tooling that enables you to get even more granular data from our applications, and more! Our biweekly newsletters will contain all you need to know on product updates, so keep an eye on your inbox.
To those who have been along for the ride during this incredible year, thank you so much. For those of you who haven’t, what are you waiting for? Get started with Replica!
Happy Holidays,
The Replica Team


