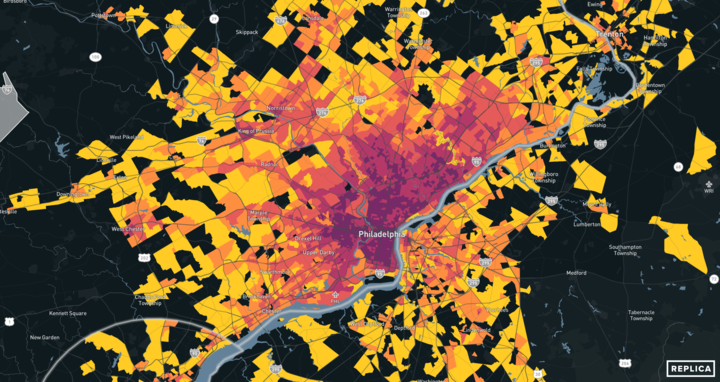
This month, Replica updated its Trends product with new economic activity data that shows how consumer spending online compares to in-person spending in three categories: retail, groceries, and bars/restaurants.
With fresh spending data for each census tract each week, and historical data going back to 2019, it’s now possible to use Replica Trends to see how the pandemic changed people’s online and in-person shopping habits nationwide, down to individual census tracts.
With this update, we dug into how retail spending in particular has changed in each state since before the pandemic. Here’s what we found.
Online retail spending remains a fraction of in-person spending
Online shopping gained ground nationwide at the start of the pandemic, but all the chatter about a sea change in consumer behavior doesn’t reflect what has happened since. Even at the height of lockdowns, in April 2020, online retail spending peaked at 36.6% of all retail spending.

For three months, online retail spending remained relatively high as a share of all retail spending, but settled back to about one-quarter by June 2020.
Physical stores have captured more than 75% of all retail spending each month since then, with three exceptions: November 2020, when online retail reached 26.9%, November 2021 (25.6%), and January 2022 (25.5%) during the emergence of the Omicron variant.
To secure an equitable economic future, the United States must ensure that environmental and economic justice are key considerations in how we govern. That means investing and building a clean energy economy … turning disadvantaged communities — historically marginalized and overburdened — into healthy, thriving communities.
– Section 219, Executive Order, January 27, 2021
In-store retail spending is up in all 50 states — but there’s a big range
Inflation has certainly contributed to more spending overall, but even adjusted for 2022 dollars, consumers in every state spent more in physical retail locations in February 2022 than in February 2019.
That increase doesn’t look the same everywhere, though. Five states saw in-store retail spending grow by more than 30%, while 10 states saw 10% or less. The average increase across all states was 16.7%.
Five largest increases in in-person retail spending:
- Iowa: 47.2%
- Alabama: 33.8%
- Connecticut: 33.7%
- Arizona: 33.6%
- Washington: 30%
Five smallest increases in in-person retail spending:
- Oklahoma: 0.7%
- Alaska: 3.5%
- Mississippi: 4.7%
- Louisiana: 6.0%
- North Carolina: 7.2%
Online retail spending saw a much bigger spread
Online retail spending looks quite a bit different: Ten states saw increases of 20% or more, while another 14 saw a decline in real terms. Ten states were more or less flat, posting less than 2% change in either direction. The average among states was an increase of 8.3%.
It’s worth noting that February 2022 was an especially volatile moment for the supply chain, which may have affected consumer spending behaviors in unusual ways. Alaska’s large decrease, in particular, may be connected to disruptions in shipping across the U.S.-Canada border.
Five largest increases in online retail spending:
- Montana: 48.2%
- Wyoming: 47%
- New Jersey: 36.7%
- Minnesota: 33.8%
- North Carolina: 33.5%
Five largest decreases in online retail spending:
- Alaska: -43.7%
- Kentucky: -13.8%
- West Virginia: -11.1%
- Nebraska: -9.1%
- Kansas: -7.5%
Still, 12 states and D.C. saw the growth in online retail spending outpace growth in in-person spending:

Questions for further exploration
It may be years before we fully understand how the pandemic has changed people’s behaviors. The ways people use the streets, let alone shipping networks, could still see significant changes and massive volatility in the coming months and years.
We do know it’s not possible to understand these changes only in the context of mobility or consumer spending as separate categories. The two are closely interrelated, and it will be important to monitor data about both dimensions together in order to prepare for changes and understand the impact they’ll have.
Replica customers can dig further into related questions with our data, including:
- How do online/offline retail trends differ from other sectors, like groceries and restaurants?
- How has spending changed at a more granular level within each state, especially in rural vs. urban communities?
- How are macro-level economic events, like global supply-chain disruptions, affecting spending behaviors in ways that impact state and local economies?
- What other factors are driving these changes? What makes online spending more consistent in some areas compared to others?
If you’re interested in working with Replica to explore spending and mobility trends in your area, please get in touch.


