The Bipartisan Infrastructure Law represents a pivotal moment for transportation equity.
With billions of dollars available to create better, more equitable places and transportation systems, public agencies are being urged to correct harmful decisions from the past whose inequitable outcomes persist today.
Under the Justice40 initiative, transportation professionals must now demonstrate that the benefits of their investments will flow through to disadvantaged and vulnerable communities. In the past, the data available to planners couldn’t support the analyses needed to pursue these goals with confidence.
But rich, privacy-sensitive data sources are now readily available, and are changing what’s possible in transportation planning. Activity-based travel models like Replica’s allow transportation professionals to explore new questions about who benefits from new and existing infrastructure, and how people in different geographic, socioeconomic, and demographic communities are able to access amenities and opportunities in their cities.
The key difference with this kind of modeling is that it offers a privacy-preserving way to study travel activity tied to relevant attributes of the people taking the trips, including race and ethnicity, household income, and age. This makes it easy to overcome certain limitations of Census data caused by aggregating at various geographic levels.
These rich insights can elevate any bid for grant funding from the U.S. Department of Transportation, including under the Safe Streets For All and Reconnecting Communities programs.
Below is a sample of questions related to transportation equity that can be easily explored in Replica’s web interface. Click the questions below to skip ahead:
- How do disconnected communities reach the city around them?
- What infrastructure do disadvantaged communities rely on most?
- Where do low-income commuters rely on transit in late-night and early-morning hours?
- What can I know about inequities in white vs. nonwhite transit riders?
- How should I target community outreach to capture feedback from those most impacted by a policy intervention?
How do disconnected communities reach the city around them?
The Reconnecting Communities program dedicates funding to efforts that serve communities that have been severed from the city around them by past infrastructure decisions.
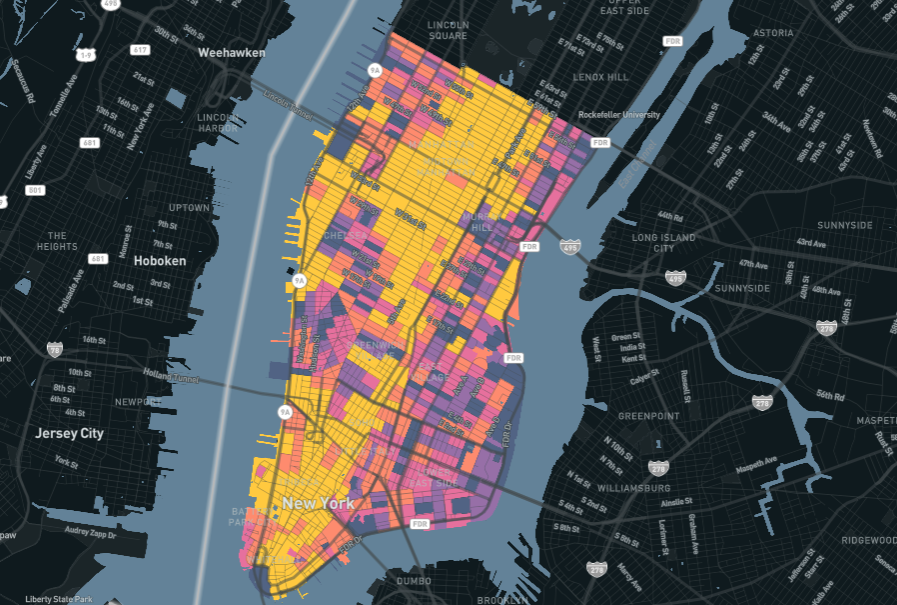
Denver’s Globeville neighborhood, a majority-nonwhite area just northeast of the intersection of I-70 and I-25, has long been recognized as a community that was cut off by interstate and rail construction. Though it sits near downtown and along bus and rail lines, we can look at the attributes of short trips (under 4 miles, in this case) and see that there are fewer trips that cross both interstates, toward the central business district. Though Globeville sits just off multiple bus and rail lines, it has few stops — transit accounts for less than one percent of short trips, while private autos exceed 45%.
Studying where and how residents do — and don’t — travel from a disconnected community can yield important insights. Replica partners have used this data to study areas that have less walking than expected, potentially because of dangerous conditions or lacking infrastructure, and to identify where new investments could convert short trips from cars to biking and walking.
What infrastructure do disadvantaged communities rely on most?
If you’re using federally defined Disadvantaged Communities or other custom geographic areas to represent underserved or vulnerable populations for your equity analyses, you can quickly understand how people in these communities engage with transportation systems in the area for different purposes.
In this example, we look at road network volumes for residents of Disadvantaged Communities in Grand Rapids, Michigan. We can quickly identify differences in activity based on trip purpose. While Route 11 above shows high volumes for work trips, filtering for errands trips shows greater activity along Kalamazoo Road.
Corridor and origin-destination analyses like these can support project prioritization and enable new understandings of how vulnerable residents will be impacted during construction, and benefit from improvements in the future.
Where do low-income commuters rely on transit in late-night and early-morning hours?
As a new normal takes shape amid the Covid-19 pandemic, public agencies need to understand who is most reliant on public transit services, and how they’re being served.
Here, we see the census tracts of Seattle residents who have household incomes under $50,000 and who commute to work by transit in evening, late-night, and early-morning hours (between 7pm and 7am).
With deep uncertainty about the return to office and its effects on public transit services, analyses like this one can inform considerations about shifting transit routes and schedules to capture riders who are most reliant on transit in off-peak hours, when services might be reduced or nonexistent.
What can I know about inequities in white vs. nonwhite transit riders?
When evaluating inequities in transit systems, it helps to get a full view of the differences in the ways cohorts of the population rely on transit.
We looked at ridership in Nashville to understand the ways white riders, who are responsible for 64% of all transit trips, differ from nonwhite riders. More than two-thirds of white riders have household incomes above $75,000, while 61% of nonwhite riders have household incomes below $50,000. Private vehicle access reveals another important dynamic: More than half (53%) of nonwhite riders come from zero-car households, compared to just 10% of white riders.
Further insights from Replica about trip purpose, duration, and origin-destination locations can be used to guide studies and decision-making about routing, scheduling, and supporting infrastructure based on any number of goals at the local level.
How should I target community outreach to capture feedback from those most impacted by a policy intervention?
When conducting community outreach, it’s important that you have the information you need to start the conversation — and to target outreach to the people who are most affected by the changes that will be made.
In the map above, we show the home locations by block group for all people who traveled on a segment of Richmond, Virginia’s Warwick Road that is slated to receive a bike lane. Replica’s web interface also shows breakdowns of income, race, and age attributes of those travelers, which can be helpful in identifying who might be affected by a project and how to target marketing toward them for community engagement purposes. Additionally, a variety of related maps, charts, and figures can be quickly pulled for use in conversations with the public.
In the map below, we see home locations by block group for people who took short trips along this same segment (under 4 miles), as well as how and why they travel there, which can be useful data for conversations about why, how, and if people might benefit from new infrastructure.
***
Deep insights about inequities in the built environment are easier to obtain than many transportation professionals might expect. What we’ve demonstrated here can be gleaned in a few clicks in Replica’s web interface, for anywhere across the continental United States. The rich datasets underlying these examples contain even more information that can guide any agency’s transportation equity efforts.
As you’re evaluating data for transportation equity projects, consider asking these questions of any data vendor to find out how they can support your work:
- How does your data overcome the limitations and biases that come from aggregating population attributes to census geographies?
- How do your products tie attributes that matter for equity — like household income, race and ethnicity, or age — to specific travel activity?
- How do you ensure your data does not compromise the privacy of the same vulnerable groups we’re trying to help?


.jpg)